Financial Data
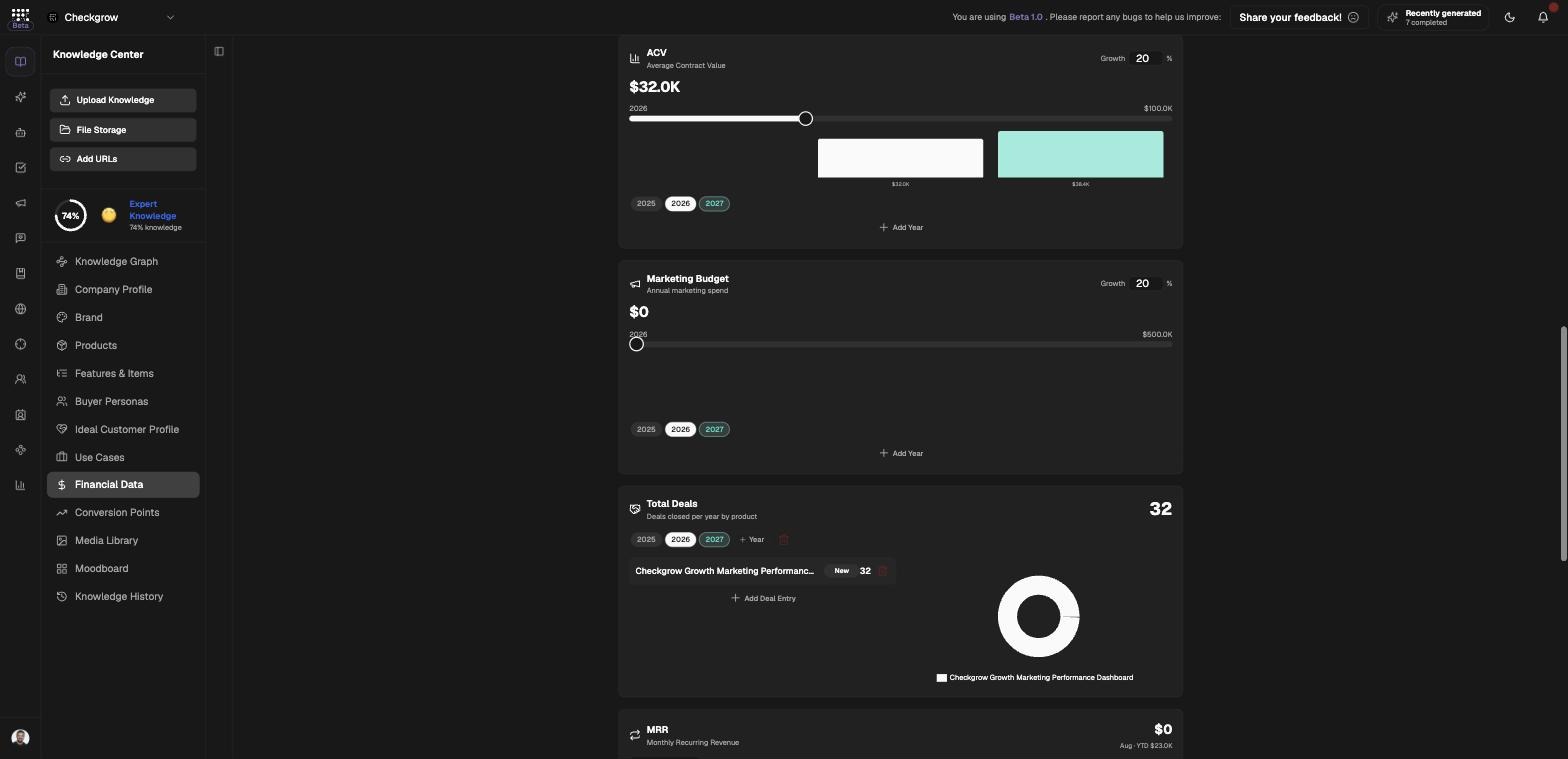
Record your company's money facts — revenue history, deal metrics, monthly MRR, funding, and legal status — as structured context for the AI.
Overview
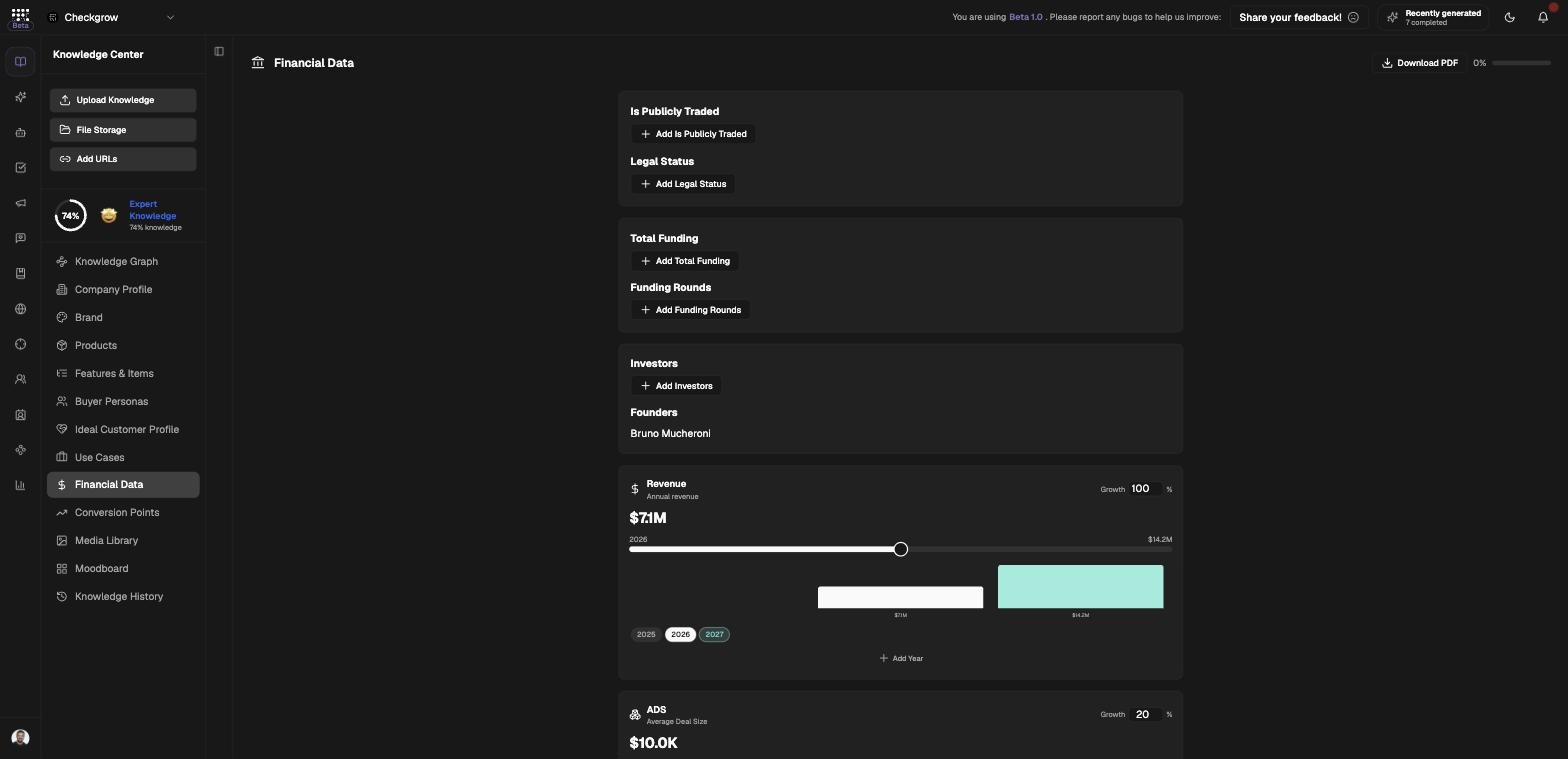
Financial Data holds your company's money facts in one place: year-by-year metric cards for revenue and deal metrics, a monthly MRR chart, and cards for funding and legal status. It sits alongside your Company Profile as the numbers side of your company record.
Everything you enter counts toward your financial knowledge score and becomes company context for the AI Assistant and AI Agents.
Numbers the AI can reason with
Enter your revenue history and deal metrics once, and every AI conversation and agent run can reference real figures — growth trends, deal sizes, and budget — instead of guessing.
Who needs it
Financial Data is useful well beyond the finance team:
- Founders — keep funding rounds, investors, and legal status documented where the whole platform can use them.
- Marketing leads — record the marketing budget and average deal size so AI campaign strategy reflects real economics.
- Sales leaders — track deals per product per year and average contract value.
- SaaS operators — follow MRR month by month with YTD and growth readouts.
You do not need every card filled. Start with the metrics you actually track — each one you add improves your financial knowledge score.
How to use it
- Add a year to a metric cardOn any yearly card — Revenue, ADS, ACV, Marketing Budget, ARR, or ARPC — click Add Year. A year pill appears; click the pill, enter the value, and click Save. Repeat to build a multi-year history.
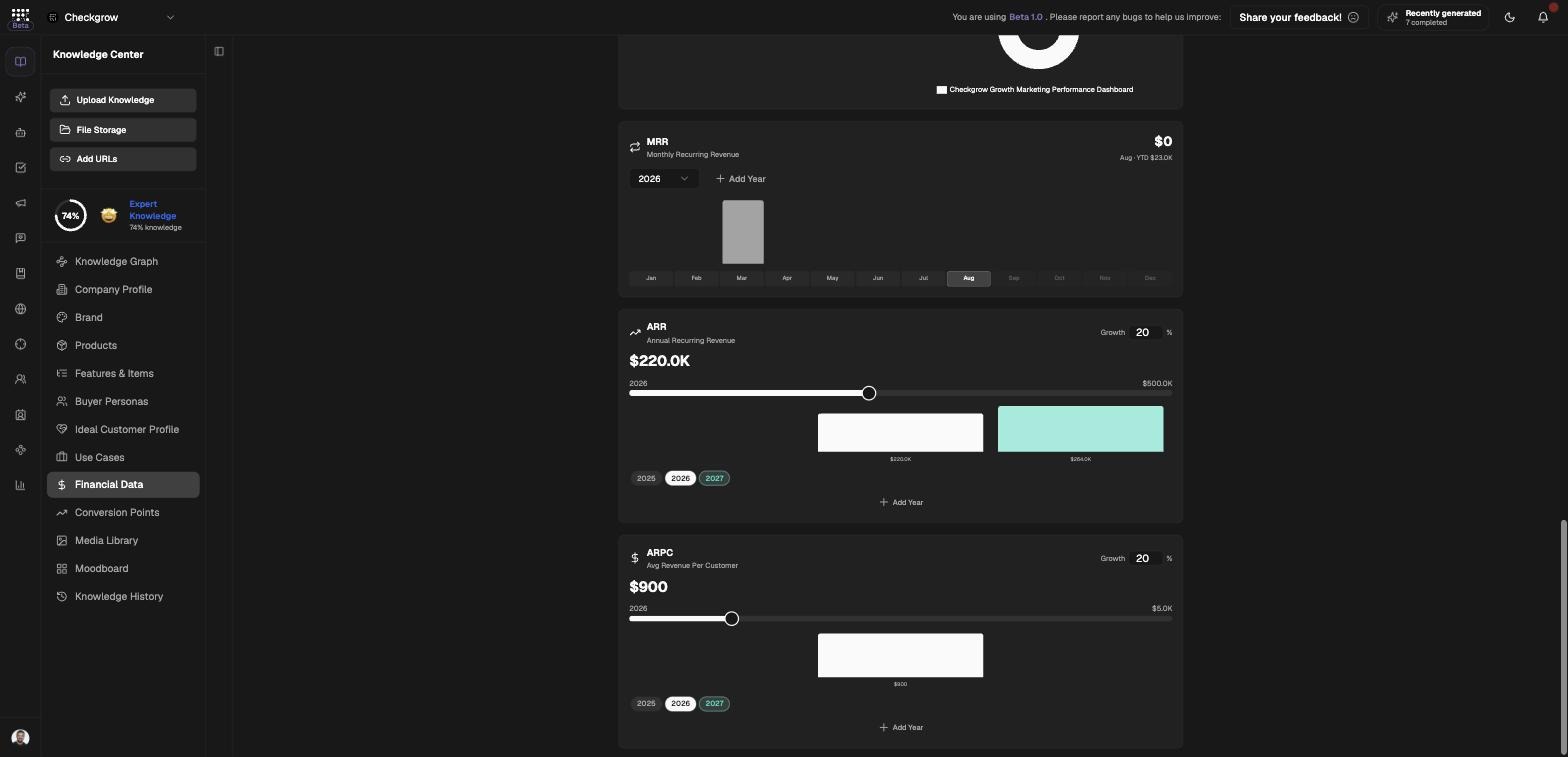
- Track MRR month by monthOn the MRR card, pick the year, then click a month bar in the 12-bar chart, enter the value, and click Save. The card shows a YTD total and a Growth readout. Future months are locked until they arrive.
- Record deals per productOn the Total Deals card, use the product select to choose a product — or "General" for company-wide deals — then add years and values the same way. This gives you deal volume per product per year.
- Fill in funding and legal factsComplete the "Is Publicly Traded", "Legal Status", "Total Funding", "Funding Rounds", "Investors", and "Founders" cards. Empty cards offer an AI Check to draft a value from your existing knowledge.
- Export as PDFClick Download PDF to export your financial data — handy for sharing a snapshot with investors or leadership.
The metric cards explained
Each card tracks one metric over time. Here is what each one records:
Revenue
ADS — Average Deal Size
ACV — Average Contract Value
Total Deals (per product)
Marketing Budget
MRR — Monthly Recurring Revenue
ARR — Annual Recurring Revenue
ARPC — Average Revenue Per Customer