
Insights
Your reporting hub: Google Analytics events, AI-summarised highlights, Meta and Google Ads reports, funnel mapping, UTM reporting and a shareable live report.
Overview
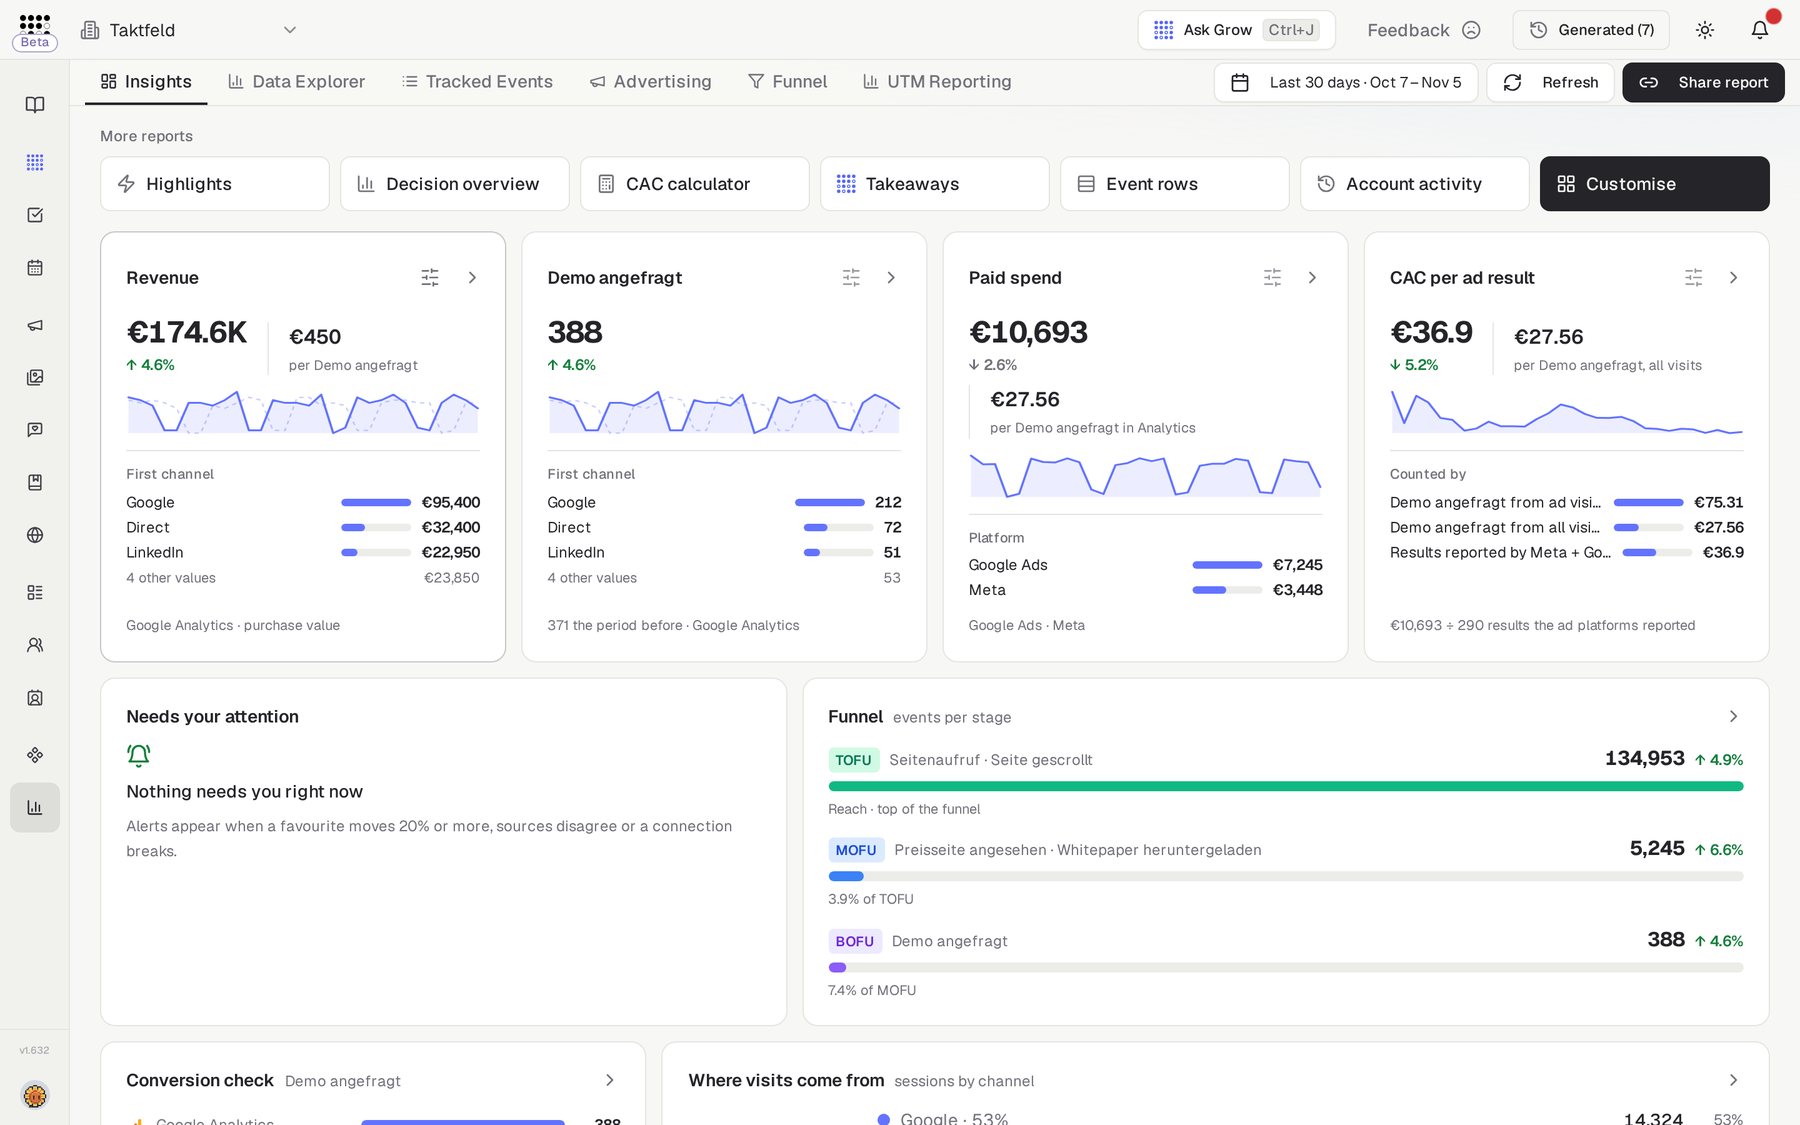
Insights is the reporting hub. One shared date range (default: last 30 days) drives five tabs — Tracked Events, Data Explorer (default), Advertising, Funnel and UTM Reporting — with Refresh, Add Event and Share report in the header.
All numbers come from server-side aggregation, and the AI narrates only figures it is given — no invented metrics.
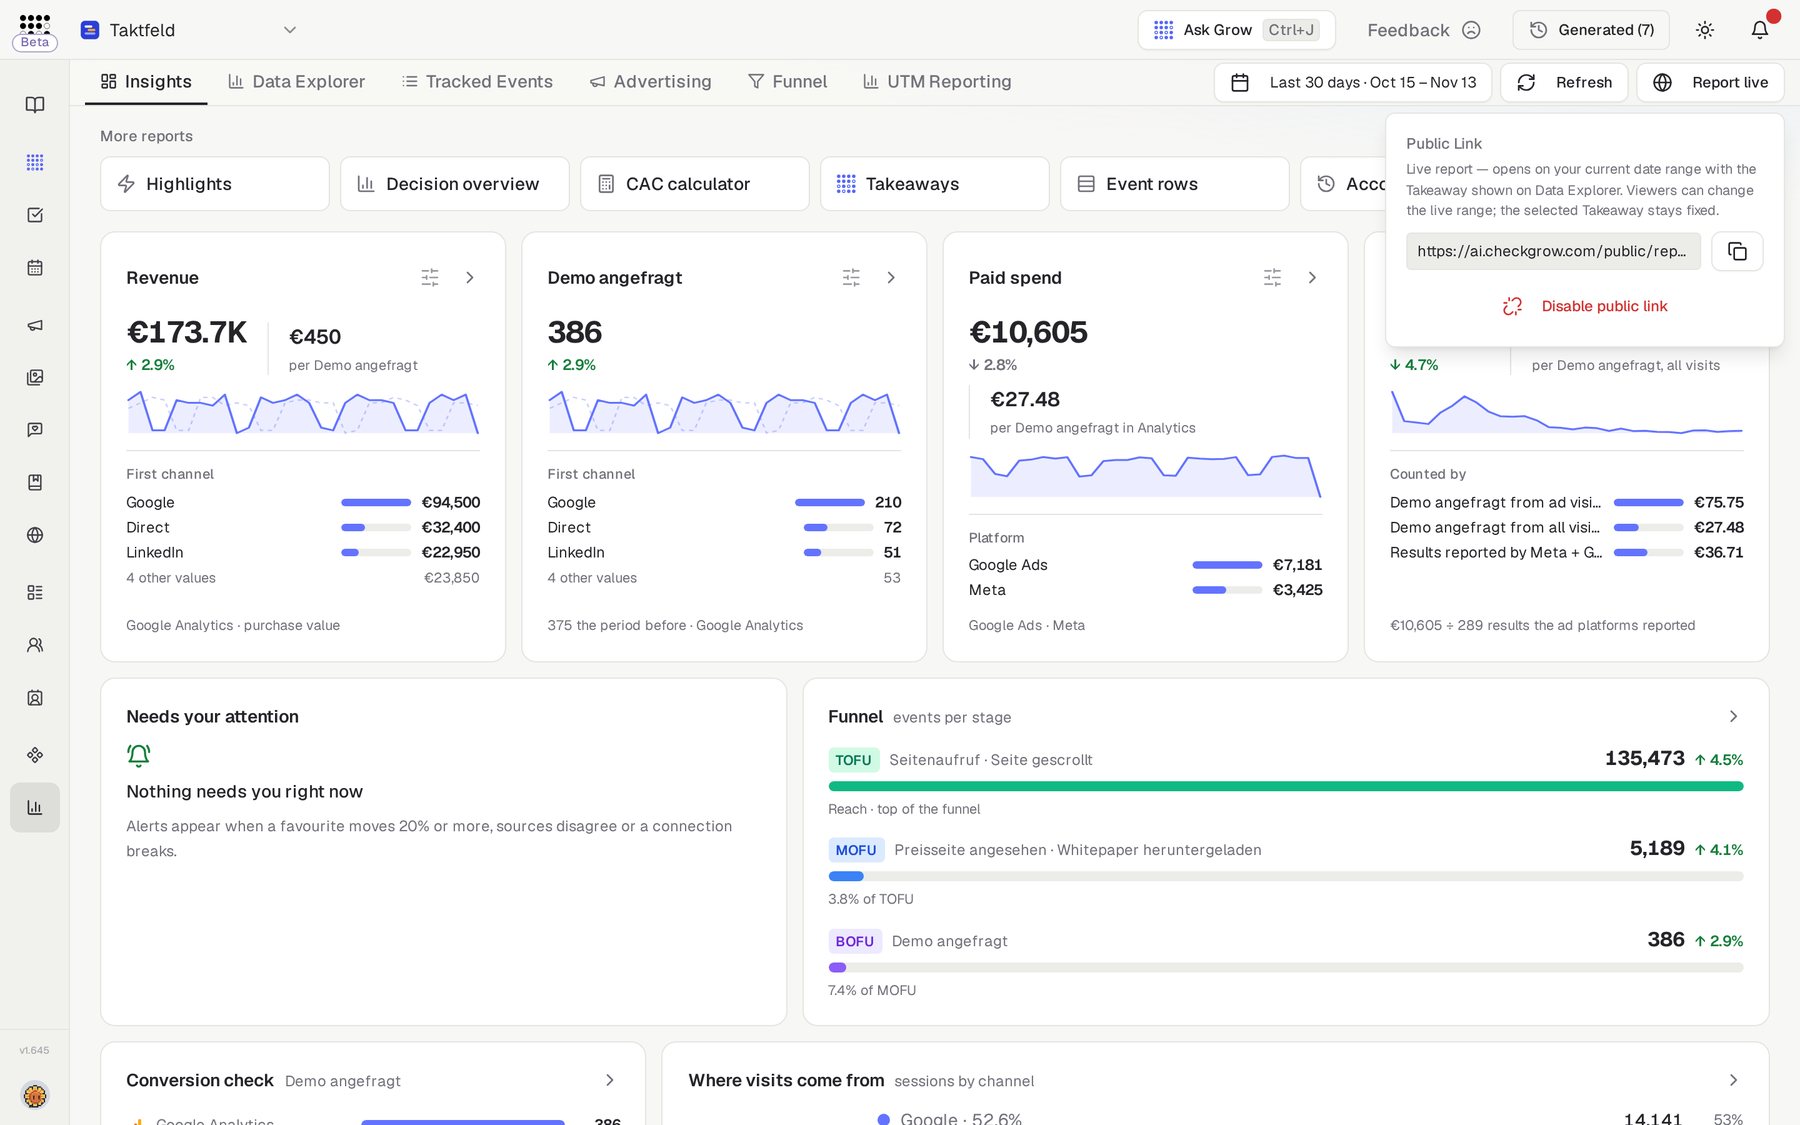
One link, a live report
Share report creates a public live link anyone can open — no Checkgrow account needed. It opens on your current date range, and viewers can change it themselves.
Who needs it
Insights replaces bouncing between GA, Meta Ads Manager and spreadsheets:
- Marketing managers tracking which conversion events actually happen on the website.
- Performance marketers comparing Meta and Google Ads spend, CTR, conversions and creatives in one place.
- Agencies and consultants sending clients a live report link instead of a monthly PDF.
- Founders who want an AI-summarised answer to "how did we do this month?" rather than raw tables.
Looking for Instagram numbers? Instagram reporting lives under Social Media, not in Insights.
How to use it
- Connect Google AnalyticsOn first visit, Tracked Events asks you to "Connect Google Analytics to discover your website's events and start tracking the ones that matter." Complete the OAuth flow and select your property — your website's events are discovered automatically.
- Add EventClick Add Event to open the "Add Events to Track" modal and pick the events that matter. Tracked events auto-backfill and get an AI funnel classification. You can track, pause, resume or sync each one, and set its funnel stage and priority.
- Connect your ad channelsOn the Advertising tab, connect Meta and Google Ads (LinkedIn is marked Upcoming) and pick the account per channel. Each channel shows the account name, the cached date range and a Change account option.
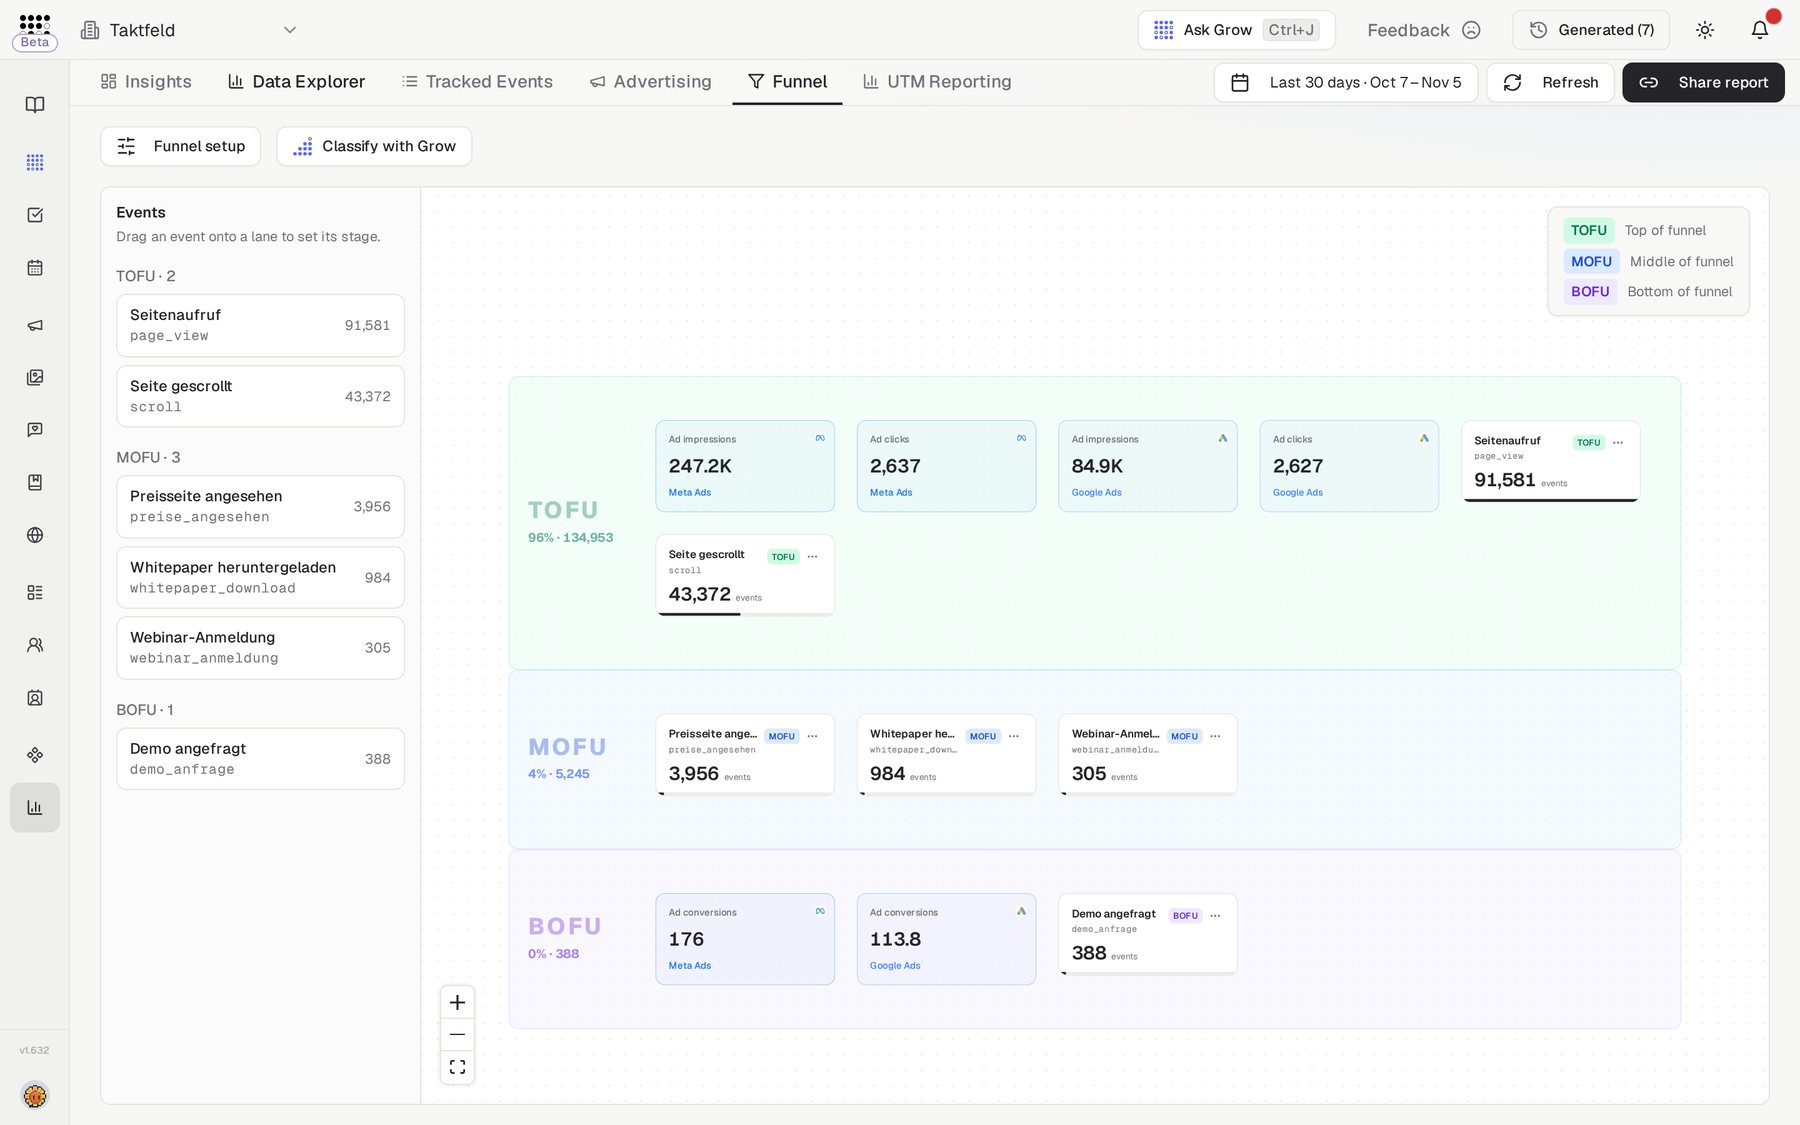
- Classify your funnelOn the Funnel tab, click Classify with AI to map your tracked events into a TOFU / MOFU / BOFU funnel.
- Share reportSet your date range, then click Share report. The public page shows Analytics, Funnel, Smart Reporting and Advertising with a "Powered by Checkgrow" footer. Anyone with the link can view; click Disable public link to revoke access at any time.
Tab reference
Tracked Events
After connecting GA it shows a summary of every discovered Google Analytics event and how many you track. Track, pause, resume or sync events, and set each one's funnel stage and priority.
Data Explorer
Pick a metric (Events, New Users or Total Users), scan the Highlights with the AI Takeaways card, read Smart Reporting ("AI-summarised insights for the selected range") and drill into the event data explorer.
Advertising
Channel sub-tabs for Meta and Google Ads with spend, CTR, conversions, creatives and a hierarchy table per account.
Funnel
Your tracked events mapped into TOFU / MOFU / BOFU stages via Classify with AI. Requires the GA connection.
UTM Reporting
Filter by All campaigns / All sources / All mediums; the table breaks down Campaign/Source/Medium, Term, Content, Sessions, Users and New Users. The UTMs on your campaign links are generated from your Conversion Points, so this tab closes the loop on which campaign drove which sessions.
Related features
Conversion Points — the source of the UTMs on your campaign links
Social Media — where Instagram reporting lives
Campaigns — the campaigns whose performance you measure here